In the following, the key measuring principles and the most important measuring instruments of our working group are presented.
Measurement principle
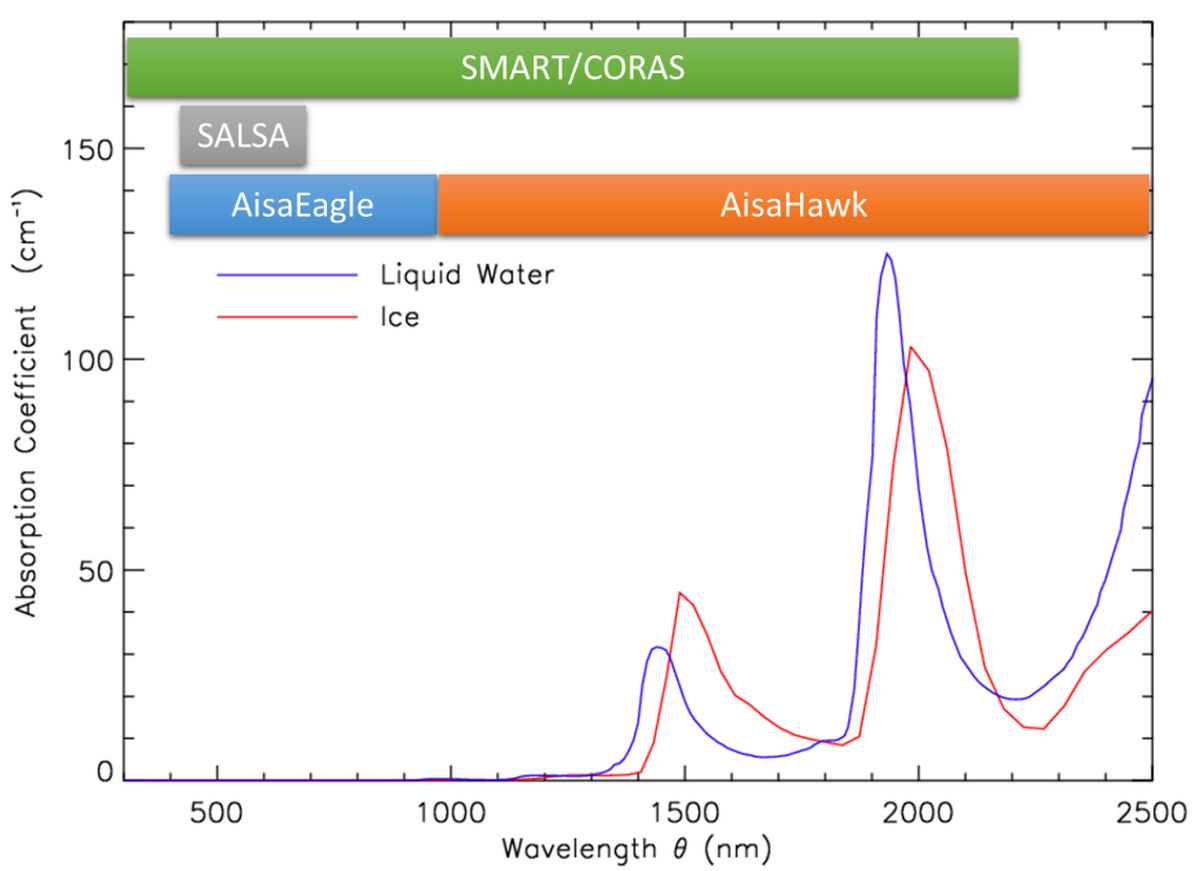
The figure below illustrates the spectral absorption coefficients of ice and liquid water at solar wavelengths between 300 nm and 2500 nm. It shows the differences in spectral absorption, which is why measurements of spectral radiation can be utilized to:
- retrieve cloud properties (optical thickness, effective radius) for liquid, ice, and mixed-phase clouds,
- discriminate between different cloud phases: liquid, ice, and mixed-phase
- discriminate between cloud and surface properties (e.g.: liquid water cloud above sea ice or ocean surfaces)
The wavelength ranges covered by some of our instruments are shown here.
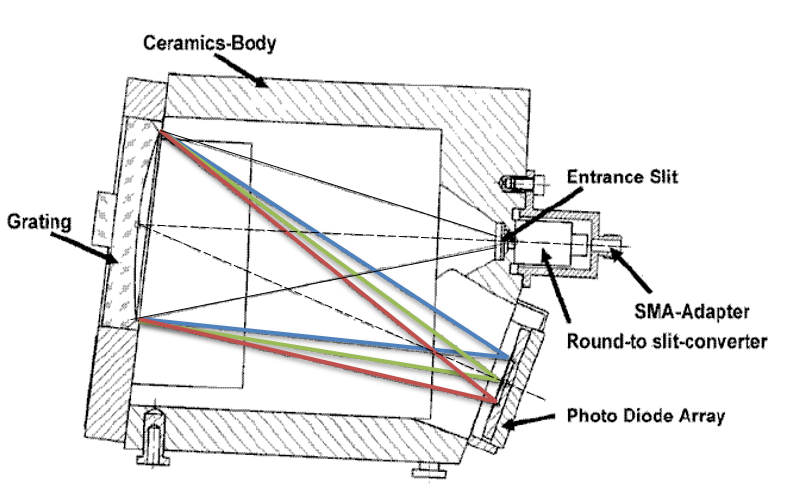
The measurements of spectral solar radiation is realized by using grating spectrometers (see figure below). Photons of different wavelength enter the spectrometer through the entrance slit. The grating disperses the radiation in order to guide photons of different wavelengths onto different parts of the single-line photodiode array.
Measuring instruments
Specification
Measured Quantity: Up-/downward (radiance, irradiance, actinic flux density)
Spatial Coverage: 1 – 2° (radiance), 180° (irradiance)
Spectral Coverage: 300 – 2200 nm, Full Width at Half Maximum: 2 – 3 nm (Visible to Near-Infrared), Full Width at Half Maximum = 9 – 15 nm (Shortwave-Infrared)
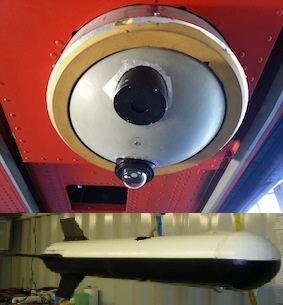
The Spectral Modular Airborne Radiation measurement sysTem (SMART-Albedometer) has been developed as a modular system to measure spectral solar radiation (irradiance, radiance, actinic radiation) from airborne platforms. The schematic setup of the instrument is illustrated in the figure below. The downwelling and upwelling radiation is collected by four optical inlets and transferred by optical fibers to grating spectrometers dispersing the incident radiation, which is then detected by a single-line photodiode array. The measurements cover a spectral range between 300 nm and 2200 nm. An active horizontal stabilization of the optical inlets is applied to correct for aircraft movement (Wendisch et al., 2001). Two optical shutters allow for simultaneous dark measurements (thermally induced current and electronic offset), which is necessary for the Shortwave-Infrared spectrometers.
Applications
The SMART-Albedometer has been applied for many years on different platforms (Polar 5 and 6, HALO, and on towed platforms like SMART-HELIOS and AIRTOSS) thereby targeting different scientific goals:
- retrieval of cloud optical thickness and effective radius,
- spectral optical layer properties of cirrus clouds,
- cloud phase identification,
- influence of ice crystal shape on cloud properties,
- spectral surface albedo measurements, and
- derivation of the aerosol
Selected publications
- Krisna, T. C., Wendisch, M., Ehrlich, A., Jäkel, E., Werner, F., Weigel, R., Borrmann, S., Mahnke, C., Pöschl, U., Andreae, M. O., Voigt, C., and Machado, L. A. T., Comparing airborne and satellite retrievals of cloud optical thickness and particle effective radius using a spectral radiance ratio technique: two case studies for cirrus and deep convective clouds, Atmos. Chem. Phys., 18, 4439-4462, doi:10.5194/acp-18-4439-2018, 2018.
- E. Bierwirth, M. Wendisch, A. Ehrlich, B. Heese, M. Tesche, D. Althausen, A. Schladitz, D. Müller, S. Otto, T. Trautmann, T. Dinter, W. von Hoyningen-Huene, W., R. Kahn, Spectral surface albedo over Morocco and its impact on radiative forcing of Saharan dust, Tellus B 61 (2009), 252-269, doi:10.1111/j.1600-0889.2008.00395.x.
- A. Ehrlich, E. Bierwirth, M. Wendisch, J.-F. Gayet, G. Mioche, A. Lampert, J. Heintzenberg, Cloud phase identification of arctic boundary-layer clouds from airborne spectral reflection measurements: Test of three approaches, Atmos. Chem. Phys. 8 (2008), 7493-7505, doi:10.5194/acp-8-7493-2008
- M. Wendisch, D. Müller, D. Schell, J. Heintzenberg, An Airborne Spectral Albedometer with Active Horizontal Stabilization, J. Atmos. Ocean. Technol. 18 (2001), 1856-1866, doi:10.1175/1520-0426(2001)018<1856:AASAWA>2.0.CO;2.
Specification:
Measured Quantity: Up-/downward (radiance, irradiance)
Spatial Coverage: 1 – 2° (radiance), 180° (irradiance)
Spectral Coverage: 300 – 2200 nm, Full Width at Half Maximum: 2 – 3 nm (Visible to Near-Infrared), Full Width at Half Maximum: 9 – 15 nm (Shortwave-Infrared)
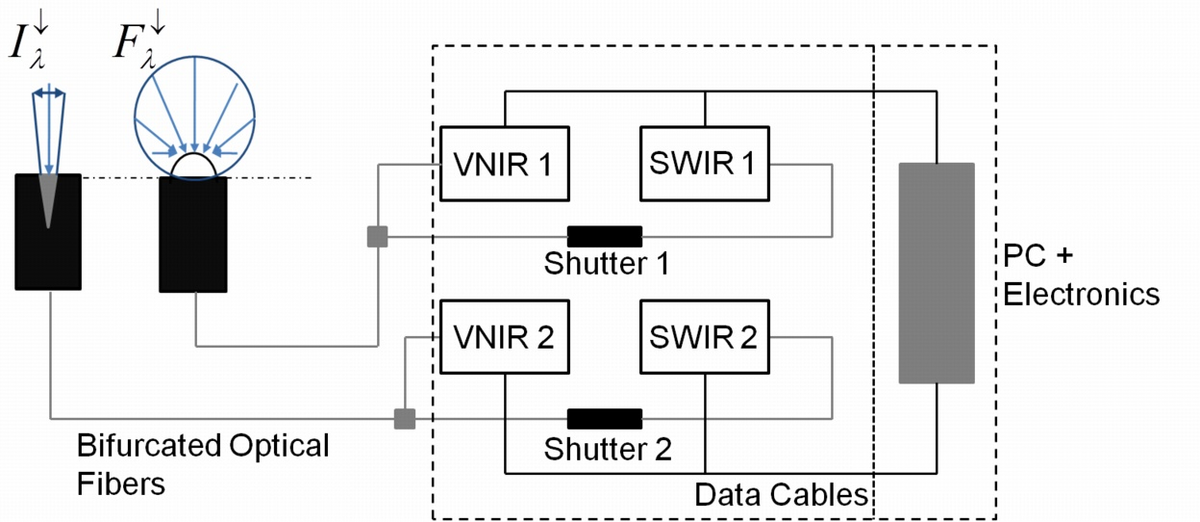
The COmpact RAdiation measurement System (CORAS) is a ground-based version of the SMART-albedometer. It is a modular system for measuring spectral solar radiation between 300 nm and 2200 nm. In principle, it can be operated in different configurations measuring up- and downward radiances and irradiances. The figure below shows the instrumental setup for the instrument setup for the configuration measuring downward radiance and irradiance. The collected photons from the irradiance and radiance inlet are transferred via two optical fibers to the spectrometer system consisting of four grating spectrometers (two for each optical inlet). The grating spectrally disperses the radiation which is then detected by a single-line photodiode array. Two optical shutters are operated to measure the dark signal (thermally induced current and electronic offset) in real-time, which is necessary for the Shortwave-Infrared spectrometers.
Applications
The CORAS instrument has been used fpr:
- measuring solar transmissivity on the Polarstern research vessel,
- measuring spectral surface albedo measurements over snow in Antarctica,
- for ground-based validation of measurements with the SMART-Albedometer.
Publications
- Brückner, M., B. Pospichal, A. Macke, and M. Wendisch, A new multispectral cloud retrieval method for ship-based solar transmissivity measurements, J. Geophys. Res. Atmos., 119 (2014), 11,338-11,354, doi:10.1002/2014JD021775.
- Carlsen, T., Birnbaum, G., Ehrlich, A., Freitag, J., Heygster, G., Istomina, L., Kipfstuhl, S., Orsi, A., Schäfer, M., and Wendisch, M.: Comparison of different methods to retrieve optical-equivalent snow grain size in central Antarctica, The Cryosphere, 11, 2727–2741, doi:10.5194/tc-11-2727-2017, 2017.
Specification
Measured Quantity: Fields of radiance
Spatial Coverage: 1024 pixels, Field Of View: 36°
Spectral Coverage: 400 – 970 nm, 488 bands, Full Width at Half Maximum:1.3 nm
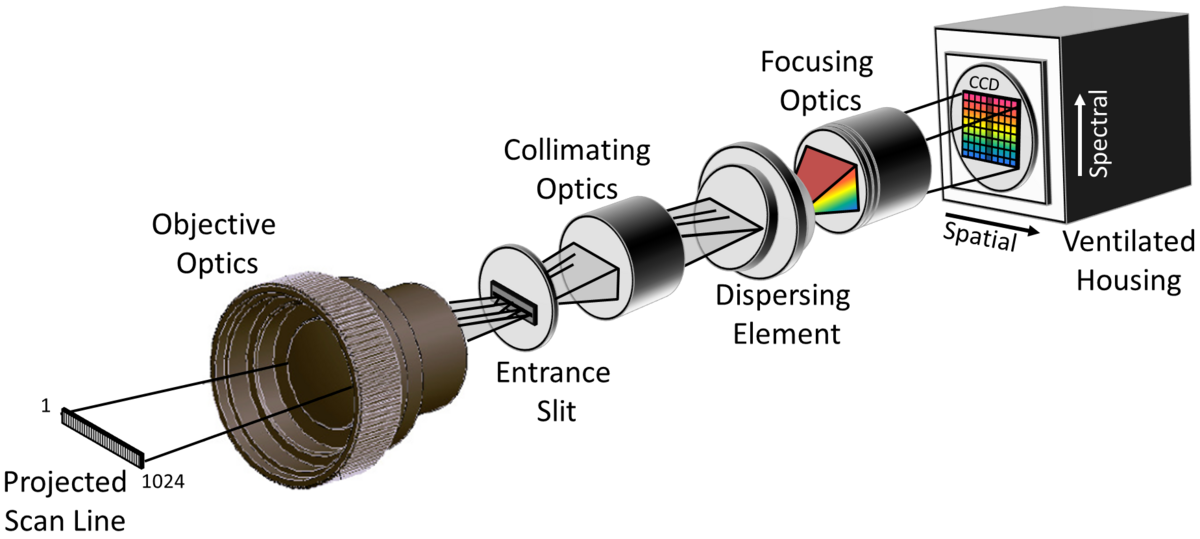
The AisaEAGLE is an imaging spectrometer, which contains a single-line sensor with 1024 spatial pixels. The instrument measures radiances in three dimensions: space, wavelength, and time. The spatial and spectral dimensions are resolved by a special set of optics that displays the image onto a two-dimensional (2D) sensor chip. The AisaEAGLE covers a wavelength range between 400 nm and 970 nm (488 spectral bands). The third dimension (time) corresponds to either the motion of the clouds passing over the sensor (ground-based application) or, in the case of airborne measurements, to the sensor movement itself. An optical schematic for the path of electromagnetic radiation detected by the center spatial pixel is shown.
The incoming solar radiation within the field of view (FOV) of AisaEAGLE is collected by a lens (objective optics) and an entrance slit. Collimating optics direct the radiation to a grating (dispersing element) where it is split into its spectral components. The spectral components are focused on the detector which consists of a charge-coupled device (CCD) element for the spatial and spectral dimensions. The field of view of the AisaEAGLE depends on the lens that is used for the measurements.
Applications
The AisaEAGLE has been successfully used for cloud measurements in an airborne and ground-based application during the following campaigns:
-
SORPIC, VERDI (Alfred-Wegner-Institut-Eagle, Bremerhaven)
-
MEGACITIES, CARRIBA, ACRIDICON-Zugspitze (Leipziger Institut für Meteorologie-Eagle, Leipzig)
The main objectives by using AisaEAGLE during those/ further measurement campaigns were/ is to investigate cloud microphysical properties such as the cloud optical thickness and in the special case of cirrus the most probable ice crystal shape. Cloud macrophysical properties such as cloud inhomogeneities and cloud shadows are also a big part of interest during the performed investigations.
Publications
- Schäfer, M., Loewe, K., Ehrlich, A., Hoose, C., and Wendisch, M., Simulated and observed horizontal inhomogeneities of optical thickness of Arctic stratus, Atmos. Chem. Phys., 18, 13115-13133, doi:10.5194/acp-18-13115-2018, 2018.
- Schäfer, M., Bierwirth, E., Ehrlich, A., Jäkel, E., Werner, F., and Wendisch, M., Directional, horizontal inhomogeneities of cloud optical thickness fields retrieved from ground-based and airbornespectral imaging, Atmos. Chem. Phys., 17, 2359-2372, doi:10.5194/acp-17-2359-2017, 2017.
- Schäfer, M., Bierwirth, E., Ehrlich, A., Jäkel, E., and Wendisch, M., Airborne observations and simulations of three-dimensional radiative interactions between Arctic boundary layer clouds and ice floes, Atmos. Chem. Phys., 15, 8147-8163, doi:10.5194/acp-15-8147-2015, 2015.
- Schäfer, M., Bierwirth, E., Ehrlich, A., Heyner, F., and Wendisch, M., Retrieval of cirrus optical thickness and assessment of ice crystal shape from ground-based imaging spectrometry, Atmos. Meas. Tech., 6, 1855-1868, doi:10.5194/amt-6-1855-2013, 2013.
- Bierwirth, E., Ehrlich, A., Wendisch, M., Gayet, J.-F., Gourbeyre, C., Dupuy, R., Herber, A., Neuber, R., and Lampert, A., Optical thickness and effective radius of Arctic boundary-layer clouds retrieved from airborne nadir and imaging spectrometry, Atmos. Meas. Tech. 6, 1189-1200, doi:10.5194/amt-6-1189-2013, 2013.
Specification
Measured Quantity: Fields of radiance
Spatial Coverage: 320 pixels, Field Of View: 36°
Spectral Coverage: 970 – 2.500 nm, 254 bands, Full Width at Half Maximum: 10 nm
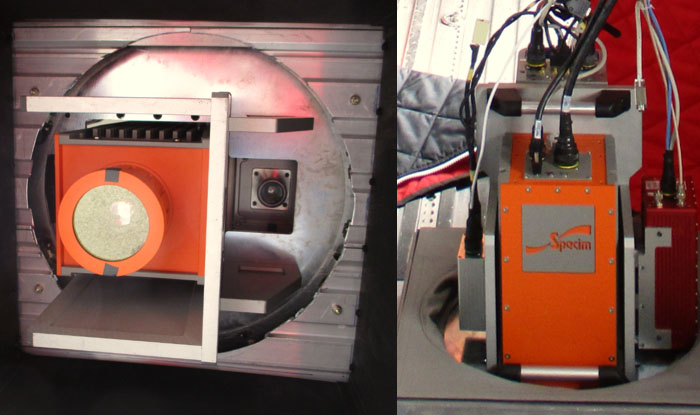
The AisaHAWK is an imaging spectroradiometer measuring within the near-infrared spectral range between 970 nm and 2500 nm, with 254 spectral bands and 320 spatial pixels. The combination of the performance of the AisaHAWK together with the AisaEAGLE imaging spectroradiometer allows the full retrieval of microphysical and optical parameters (cloud optical thickness, effective radius). The Aisa-systems are used to derive 2D field by moving the sensors, whereas the FOV of each sensor pixel is about 0.1°. Together with the increase of the time resolution compared to the non-imaging spectroradiometers by a factor of 20, the spatial information content improves significantly, which is required for studies on radiative effects on inhomogeneous clouds.
Applications
-
Cloud profiling of (deep) convective clouds (ground-based and airborne) to investigate cloud vertical evolution and life cycle (phase transition and droplet growth) by application of 3D retrieval algorithms
-
Studies on cloud - aerosol interactions of convective clouds
-
Ground-based investigation of enhanced clear sky radiation in the environment of broken clouds
-
Microphysical and optical characterization of cirrus (particle size, particle shape, optical thickness)
-
Radiative impact of cirrus on the solar energy budget
-
Adaption of conventional remote sensing techniques for Arctic boundary clouds with bright sea ice and snow surfaces below
-
Simultaneous retrieval of cloud and snow optical properties (grain size) with high spatial resolution to understand the melting of sea ice which is strongly connected to the interaction between clouds and surface
-
Validation of satellite measurements of passive sensors (e.g., MODIS) regarding the remote sensing of microphysical cloud parameters and global energy budget
Publications
- Ruiz-Donoso, E., Ehrlich, A., Schäfer, M., Jäkel, E., Schemann, V., Crewell, S., Mech, M., Kulla, B. S., Kliesch, L.-L., Neuber, R., and Wendisch, M.: Small-scale structure of thermodynamic phase in Arctic mixed-phase clouds observed by airborne remote sensing during a cold air outbreak and a warm air advection event, Atmos. Chem. Phys., 20, 5487–5511, doi:10.5194/acp-20-5487-2020, 2020.
- Ehrlich, A., Wendisch, M., Lüpkes, C., Buschmann, M., Bozem, H., Chechin, D., Clemen, H.-C., Dupuy, R., Eppers, O., Hartmann, J., Herber, A., Jäkel, E., Järvinen, E., Jourdan, O., Kästner, U., Kliesch, L.-L., Köllner, F., Mech, M., Mertes, S., Neuber, R., Ruiz-Donoso, E., Schnaiter, M., Schneider, J., Stapf, J., and Zanatta, M., A comprehensive in situ and remote sensing data set from the Arctic CLoud Observations Using airborne measurements during polar Day (ACLOUD) campaign, Earth Syst. Sci. Data, 11, 1853–1881, doi:10.5194/essd-11-1853-2019, 2019.
Specification
Measured Quantity: Full Stokes vector
Spatial Coverage: 1920 x 1080 pixel, Field Of View: 100°
Spectral Coverage: RGB
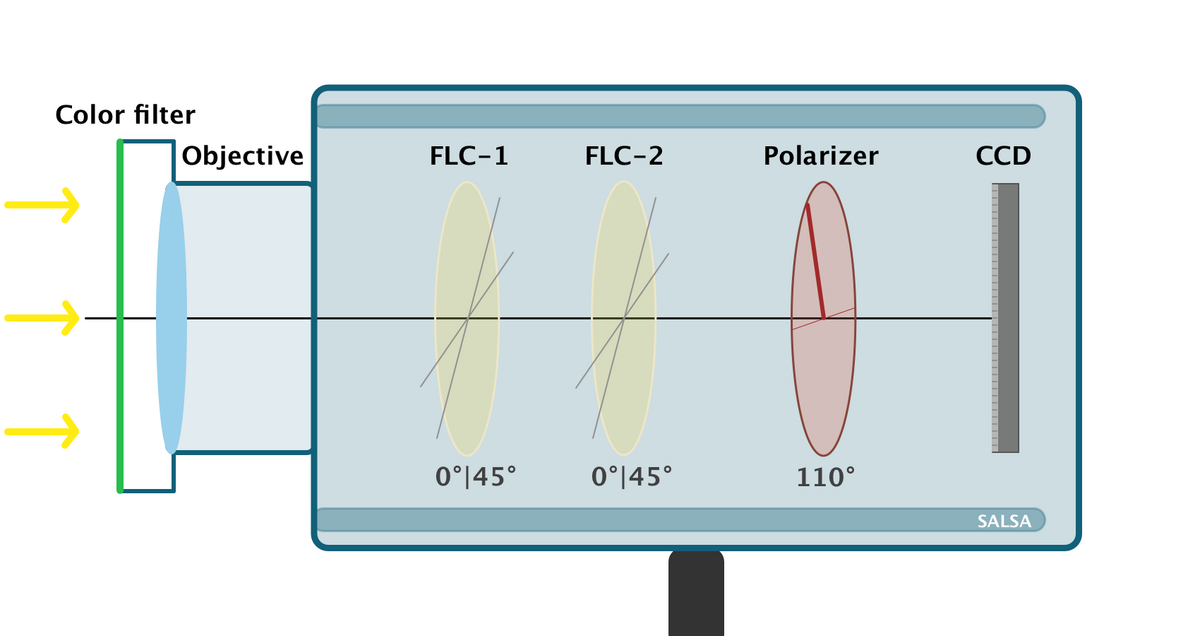
TThe SALSA polarization camera from Bossa Nova Technologies (dimensions: 80 mm × 80 mm × 100 mm) is a passive polarimeter as it measures the radiation of an external source. It is a division-of-time polarimeter. To measure the Stokes vector S, four consecutive measurements are needed. Within the compact camera illustrated in figure, the incident radiation initially passes through a color filter before entering the objective (type: NMV-5M23 by Navitar, focal length: 5 mm, manual focus, iris aperture).
The polarization state analyzer (PSA) consists of two ferroelectric liquid crystals (FLCs) and a fixed linear polarizer (transmission axis relative to horizontal: 110°). The liquid crystals each act as a programmable phase shifter, the first with a retardation close to λ/2, the second with a retardation close to λ/4. The angle of the optical axes of the FLCs with respect to the horizontal can be switched between 0 and 45 degrees. After passing the PSA, the radiation eventually reaches the CCD sensor (type: Basler avA1900-50gm, 1920 ×1080 pixel).
Applications
Until now, we used the SALSA Full Stokes polarization camera for measurements under cloudless conditions to capture characteristic features of Rayleigh scattering within the atmosphere.
Publications
Carlsen, T., Ehrlich, A., Wendisch M., Characterization and calibration of a Full Stokespolarization camera, Wiss. Mitteil. Inst. f. Meteorol. Univ. Leipzig, Band 53(2015), 2015.
Specification
Measured Quantity: Directional radiance
Spatial Coverage: 3888 x 2592 pixels (Canon) or 5584 x 3728 (Nikon), Field Of View = 180°
Spectral Coverage: RGB
We employ measurements with a commercial digital camera (Canon EOS 1D Mark III, 3888 x 2592 pixels, Nikon D5, 5584 x 3728 pixels) onboard the Polar research aircraft (Alfred Wegener Institute, Helmholtz Centre for Polar and Marine research). The camera incorporates a Complementary Metal Oxide Semiconductor (CMOS) sensor providing three spectral channels (R, G, and B). It uses a fish-eye lens with FOV of 180° to measure fields of radiances from an entire hemisphere. Therefore, it is possible to measure the radiation reflected at the surface under all viewing angles to derive HDRF and BRDF of the surface. In this regard, it is necessary to calibrate the camera both radiometrically and geometrically. The radiometric calibration is carried out in the laboratory by means of an integrating spehre traceable to the National Institute of Standards and Technology (NIST). The geometric calibration is necessary due to image distortion as a result of the photon path through the fish-eye lens. It utilizes images of the night sky (known star positions) or images of a chessboard target.
Applications
- HDRF/BRDF measurements of different surfaces (ocean, sea ice, snow) and clouds
- surface type classification and type fraction
Publications
- Carlsen, T., Birnbaum, G., Ehrlich, A., Helm, V., Jäkel, E., Schäfer, M., and Wendisch, M., Parameterizing anisotropic reflectance of snow surfaces from airborne digital camera observations in Antarctica, The Cryosphere, 14, 3959–3978, doi:10.5194/tc-14-3959-2020, 2020
- Jäkel., E., Stapf, J., Wendisch, M., Nicolaus, M., Dorn, W., and Rinke, A., Validation of the sea ice surface albedo scheme of the regional climate model HIRHAM-NAOSIM using aircraft measurements during the ACLOUD/PASCAL campaigns, The Cryosphere, 13, 1695-1708, doi:10.5194/tc-13-1695-2019, 2019
- A. Ehrlich, E. Bierwirth, M. Wendisch, A. Herber, and J.-F. Gayet, Airborne hyperspectral observations of surface and cloud directional reflectivity using a commercial digital camera, Atmos. Chem. Phys. 12 (2012), 3493-3510, doi:10.5194/acp-12-3493-2012.
VELOX (Video airbornE Longwave Observations within siX channels)
Specification
Measured Quantity: Brightness temperature, Radiance
Spatial Coverage: 640 x 5120 spatial pixel, Field Of View = 35.5° x 28.7°
Spectral Coverage: 7.7 –12 μm, 6 bands
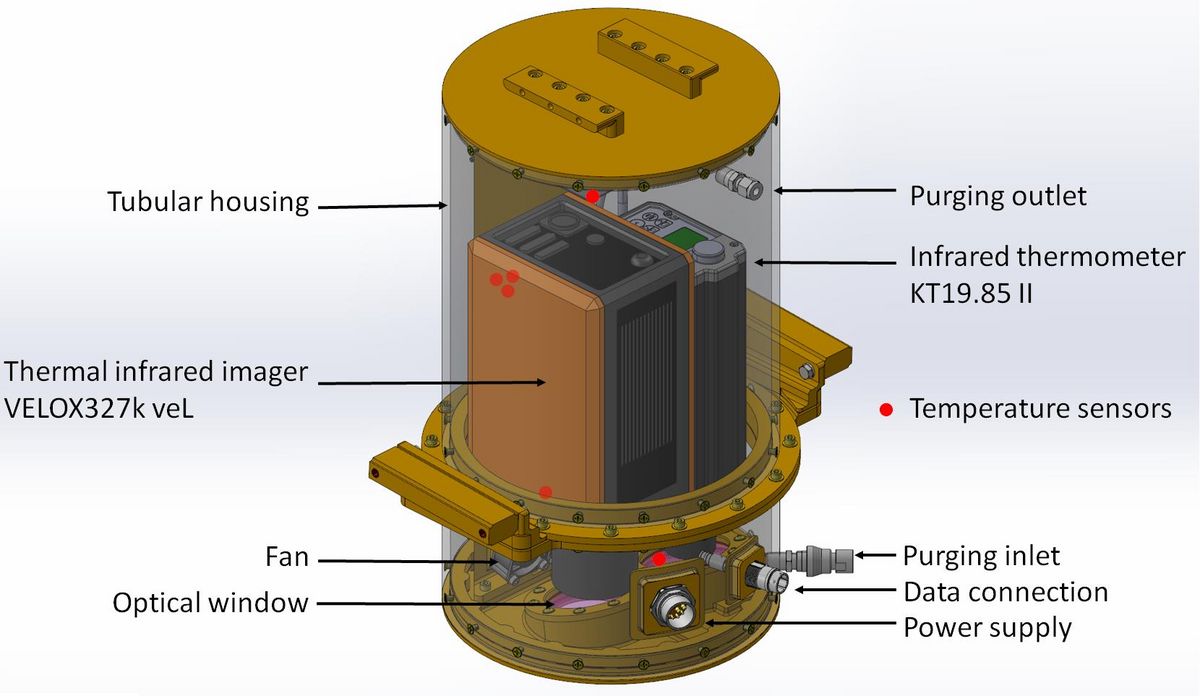
The thermal-infrared imager VELOX (Video airbornE Longwave Observations within siX channels) onboard HALO provided two-dimensional (2D) cloud-top or surface brightness temperature (BT) fields. The imager has a field of view of 35.5° by 28.7° (640 by 512 spatial pixels) yielding a spatial resolution of 10 m at a target distance of 10 km. The brightness temperature is measured in six spectral bands (BT1 to BT6) in the thermal-infrared wavelength range from 7.7 to 12.0 µm. Currently, BT1 and BT4 provide redundant broadband measurements for this full spectral range. The remaining four channels are narrow-band channels with central wavelengths and half-widths at 8.65 +/- 0.55 μm (BT2), 10.74 +/- 0.39 μm (BT3), 11.66 +/- 0.81 μm (BT5), and 12.00 +/- 0.50 μm (BT6).
Varioscan 3021 ST
Specification
Measured Quantity: Brightness temperature
Spatial Coverage: 240 x 360 pixel, Field Of View = 30° x 20°
Spectral Coverage: 8 –12 μm
The Varioscan 3021 ST is an imaging thermal infrared camera with a spatial resolution of 240 x 360 pixels. It measures the brightness temperature in the thermal spectral range of 8 μm to 12 μm. It´s thermal resolution at 30°C is +/ - 0.03 K and it covers a measurement range from -40°C to 1200°C. With a measurement frequency of up to 130 Hz, a temporal resolution of 0.2-0.8 s can be achieved. The measurement principle is based on thermographic image capturing of a scanning camera with a field of view of 30° x 20°.
Xenics Gobi-640-GigE
Specification
Measured Quantity: Brightness temperature
Spatial Coverage: 640 x 480 pixel, Field Of View = 35° x 27°
Spectral Coverage: 8 –12 μm
The uncooled thermal imaging camera Xenics Gobi-640-GigE reaches frame rates of 50 Hz at an resolution of 640 x 480 pixels. It measures the brightness temperature within the wavelength range of 8 μm to 14 μm with an Noise Equivalent Temperature Difference (NETD) at 30°C of 50 mK. The IR camera measures temperatures down to -20°C and has a Field of View of 35° x 27°.
Applications
We currently employ three different IR cameras, a Varioscan 3021 ST, a Xenics Gobi-640-GigE, and VELOX (owned by MPI for Meteorology, Hamburg). We use them for:
-
brightness temperature profiles of clouds and atmosphere,
-
cloud side profiling for cloud phase retrieval,
-
sea-surface temperature retrieval,
-
surface type classification,
-
cloud-top altitude retrieval, and
-
cloud masking

Publications
Schäfer, M., Wolf, K., Ehrlich, A., Hallbauer, C., Jäkel, E., Jansen, F., Luebke, A. E., Müller, J., Thoböll, J., Röschenthaler, T., Stevens, B., and Wendisch, M.: VELOX – A new thermal infrared imager for airborne remote sensing of cloud and surface properties, Atmos. Meas. Tech., 15, 1491–1509, doi:10.5194/amt-2021-341, 2022.
Siebert, S., Szodry, K.-E., Egerer, U., Wehner, B., Henning, S., Chevalier, K., Lückerath, J., Welz, O., Weinhold, K., Lauermann, F., Gottschalk, M., Ehrlich, A., Wendisch, M., Fialho, P., Roberts, P. F. G., Allwayin, N., Schum, S., Shaw, R. A., Mazzoleni, C., Mazzoleni, L., Nowak, J. L., Malinowski, S., Karpinska, K., Kumala, W., Czyzewska, D., Luke, E. P., Kollias, P., Wood, R., Mellado, J. P., Observations of aerosol, cloud, turbulence, and radiation properties at the top of the marine boundary layer over the Eastern North Atlantic Ocean: The ACORES campaign, Bull. Am. Meteorol. Soc., 102(1), E123-E147, doi:10.1175/BAMS-D-19-0191.1, 2021.
